SEA Ice -- Cooling The Fear Of Human-Caused Climate Change

Sea ice in Earth's Northern Hemisphere is melting and growing erratically, while sea ice in Earth's Southern Hemisphere is growing steadily. Both trends indicate that human beings are NOT causing global warming.
What Is Sea Ice?
Sea ice is ice formed in ocean water that freezes, in the oceans of Earth’s North and South Poles. Sea ice is not the same as ice bergs, which are chunks of glaciers that break off and float in the ocean.
Sea ice occupies about 7% of planet Earth’s surface area. Sea ice thickness and spatial extent change rapidly in response to seasonal changes and in response to longer-term climate changes. Sea ice occupies ocean waters of the North Pole (Arctic) and South Pole (Antarctic) year round to some degree. Generally, however, the seasonal melting and reforming of Arctic sea ice is less than the seasonal melting of Antarctic sea ice. In other words, more Antarctic sea ice melts per season than Arctic sea ice, due to geographical differences between the two Polar Regions. [REFERENCE -- Ole Humlum (Professor in Department of Geoscience, University of Onslo), Sea Ice, Climate4You website, (an extensive website section with numerous graphs on sea ice), http://www.climate4you.com/SeaIce.htm]
Arctic And Antarctic Geographical Differences
Refer to the two maps below, and notice that the Arctic and Antarctic are vastly different geographical regions. The Arctic (North Pole) is an ocean surrounded by land, while the Antarctic (South Pole) is land surrounded by an ocean.
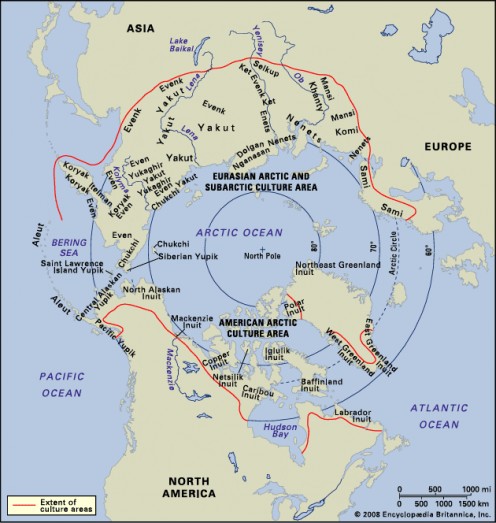
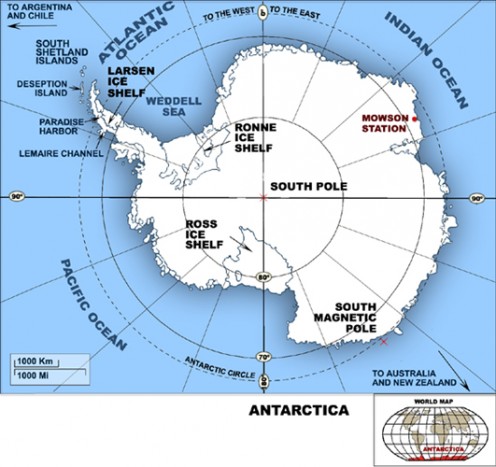
There is NO Arctic continent – there is only sea ice in the Arctic Ocean, which is surrounded by extremities of the various Northern Hemisphere continental landmasses. On the other hand, there IS an Antarctic continent – a landmass twice the size of Australia, or the size of the United States and Mexico combined. [See comparison map below] The Antarctic landmass is entirely covered by an immense, thick glacier, and this entire continent (consisting of land and glacier) is surrounded by ocean waters that freeze to form sea ice.

To clarify, sea ice at the Arctic (North Pole) is all there is, while sea ice at the Antarctic (South Pole) is in addition to the immense glacial ice that covers the land.
Fear Of Melting Sea Ice
In the news, Arctic sea ice seems more of a focus (and more of an issue) because at the Arctic, if all that sea ice melted, then there would be only ocean underneath. Consequently, the phrase, “polar ice cap melting”, means entirely different things for the North and South Poles. For the North Pole, it means that the sea ice melts (0.01 % of the world’s ice). For the South Pole, it means that a thick glacier twice the size of Australia, in addition to the sea ice, melts (90% of the world’s ice). [See World Ice Inventory Table]
It is important to keep these regional distinctions in mind, when considering climate change and threats of global warming.
Because sea ice appears and disappears with the seasons, it lends itself to many misperceptions. From year to year, even on the same day of the same season, sea ice extent can differ considerably. A person could easily become alarmed to find a million square kilometers less sea ice than on the same day of a previous year where there might have been a million square kilometers more. This seemingly huge difference is a normal variance. [REFERENCE -- National Snow and Ice Data Center, All About Sea Ice, Characteristics: Arctic vs. Antarctic, http://nsidc.org/seaice/characteristics/difference.html]
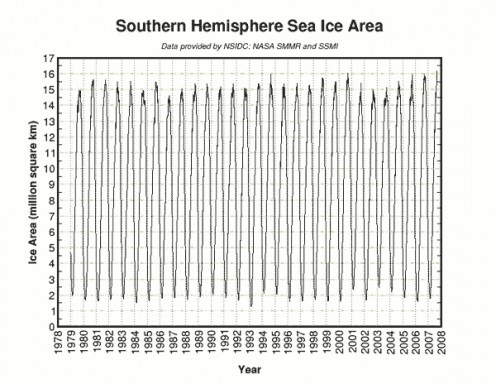
The following graphs [see below] show Arctic (Northern Hemisphere) and Antarctic (Southern Hemisphere) sea ice area for years 1978 to 2008:
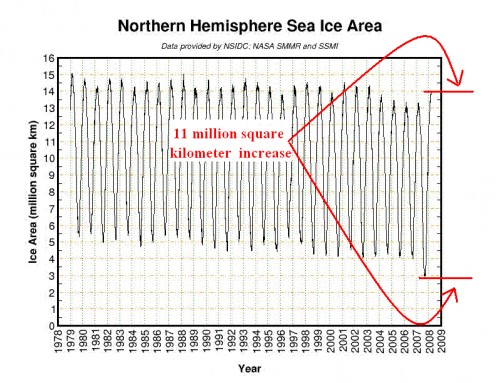
These graphs of sea ice area show:
- the extent of Arctic (Northern Hemisphere) sea ice appears to be shrinking a bit, with a slight recovery in 2008 from a 2007 record low,
- the extent of Antarctic (Southern Hemisphere) sea ice appears to be the same or slightly growing, with a thirty-year record high during the same year the Arctic experienced its record low.
Now look at the next graph [see below], which compares Arctic and Antarctic sea ice extent to total global sea ice extent:
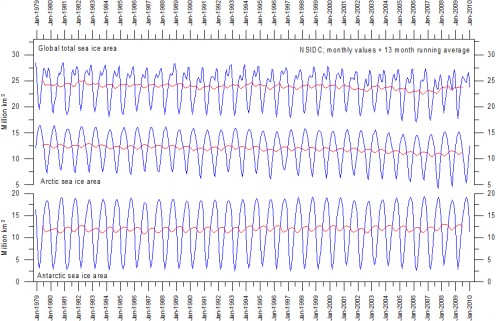
Notice that the decrease in Arctic sea ice appears balanced by the increase in Antarctic sea ice, which means there is NO DECREASE in global sea ice over this period. Sea ice, therefore offers NO compelling evidence of alarming global warming. Furthermore, to attribute sea ice loss and growth to CO2 forcing of global temperature is even less plausible.
Even so, people who are alarmed by human-caused global warming insist that the normal variance of Arctic sea ice has become abnormal (considerably more ice lost per season than previous seasons). They also insist that the greater-than-normal increase in Antarctic sea ice offers no evidence against human-caused global warming.
Setting The Record Straight
The Arctic is a semi-enclosed ocean that ordinarily keeps sea ice more stable, while the Antarctic is a continent with surrounding oceans that expose sea ice to more open ocean currents. This partly explains why the seasonal loss and growth of Antarctic sea ice is more dramatic than its Arctic counterpart.
The Arctic’s 2007 record low occurred, however, because something out of the ordinary happened: Atmospheric pressure conditions caused wind patterns that compressed the old thick sea ice, loaded it into the Transpolar Drift Stream and then increased its flow rate out of the Arctic along East Greenland. The perennial thick sea ice in March 2007 essentially was confined by winds to the Arctic Ocean north of Canada. Consequently, a larger than normal amount of thinner seasonal ice dominated most of the Arctic Ocean, melting faster. In addition, this thin ice compressed more easily and responded more quickly to winds pushing it out of the Arctic. The thinner seasonal ice conditions helped reduce the amount of ice, leading to the 2007 record low amount of total Arctic sea ice. [REFERENCE – NASA Study, http://www.nasa.gov/vision/earth/lookingatearth/quikscat-20071001.html]
Atmospheric pressure conditions such as those described above are indicative of atmospheric and oceanic cycles that scientists (only in recent years) have started to recognize. For a more detailed description of how these natural cycles influence climate, see [REFERENCE -- Global Warming Science, Arctic Oscillation (AO) and North Atlantic Oscillation (NAO), http://www.appinsys.com/GlobalWarming/AO_NAO.htm]
Long-Term Record
The previous graphs show a thirty-year period where reliable satellite data has been in existence. On a geological time scale, this is minuscule. A more correct view of sea ice is only possible by examining its fluctuations over longer periods. A more correct view of sea ice also is only possible by examining the specific manner in which it has oscillated up and down over the years.
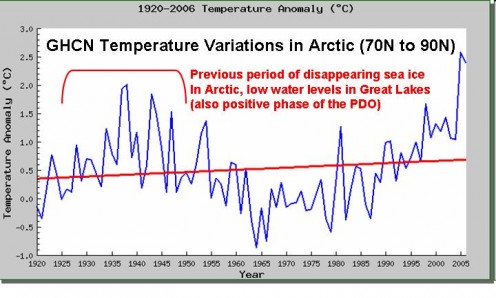
During the 1930’s, temperatures in the Arctic were nearly as warm as during recent decades [see temperature anomaly graph below]:
In 1922, newspapers also reported considerable loss of Arctic sea ice. [See copy of original report upon which newspaper stories were based]
Going back even farther, I. V. Polyakov and others examined Russian historical records of Arctic sea ice extent and thickness starting from the year 1900. They concluded:
“…examination of records of fast ice thickness and ice extent from four Arctic marginal seas (Kara, Laptev, East Siberian, and Chukchi) indicates that long-term trends are small and generally statistically insignificant, while trends for shorter records are not indicative of the long-term tendencies due to strong low-frequency variability in these time series, which places a strong limitation on our ability to resolve long-term trends…. Correlation analysis shows that dynamical forcing (wind or surface currents) is at least of the same order of importance as thermodynamical forcing for the ice extent variability in the Laptev, East Siberian, and Chukchi Seas.” [REFERENCE – I. V. Polyakov et al. (2003), Long-Term Ice Variability in Arctic Marginal Seas, Journal of Climate, 16, 2078-2085]
What Polyakov’s study means is:
- thirty years is a short period,
- observing a large loss of sea ice over a short period is misleading,
- ups and downs over these short periods can be so erratic that long-term predictions are impossible,
- wind and ocean surface currents are as much or possibly even more important than temperature in driving sea ice variability.
Another researcher, Norwegian scientist, Torgny Vinje, has done the painstaking work of collecting observations made by ships since 1864 for sea ice in the Nordic Seas. He discovered that in the Nordic Seas, the maximum extent of sea ice (April) has decreased around 33% since 1864, much of that before 1940, demonstrating that sea-ice reduction is not a new phenomena, but began long ago. He further observed that while the mean annual reduction of the April ice extent has been decelerating by a factor of 3 between 1880 and 1980, the mean annual reduction of the minimum (August) ice extent is proceeding linearly. [REFERENCE – Torgny Vinje (2001), Anomalies and Trends of Sea_Ice Extent and Atmospheric Circulation in the NordicSeas during the Period 1864-1998, Journal of Climate, February 2001, 255-267]
What Vinje’s study means is:
- the trend of reducing Arctic sea ice began in the 1860’s,
- the trend of reducing Arctic sea ice was most severe before 1940,
- the trend of reducing Arctic sea ice for April actually decelerated by a factor of 3 between 1880 and 1980,
- the trend of reducing Arctic sea ice for August remained the same between 1880 and 1980
- the 2007 Arctic sea-ice record low was a record low only for a 30-year period, NOT unusual when looking at the longer record that shows the decline really started in the 1860’s, BEFORE widespread fossil fuel use.
Both Polyakov and Vinje help confirm findings about glaciers, which tell us that Earth’s melting ice trend operates on a millennium scale, driven by millennium-scale forces other than carbon dioxide (CO2), and driven concurrently by natural climate cycles that dominate carbon-dioxide forcing of temperature.
Earth is still emerging from the last severely cold epoch of the last glacial age of the current great Quaternary Ice Age. We are fluctuating in the cold/hot rhythms-within-rhythms that characterize Earth’s millennium-scale climate.
Sea Ice Rhythms Are Out Of Sync With Climate Model Predictions
Recent Arctic sea ice behaviour is jerky, sometimes showing a seasonal growing trend and sometimes showing a seasonal declining trend. One decade, it looks like the extent is increasing; the next, it looks like the extent is decreasing. [REFERENCE – Singer and Idso, Climate Change Reconsidered, Chapter 4, Section 4.2, Sea Ice, [ http://www.nipccreport.org/reports/2011/pdf/04Cryosphere.pdf ]
On the other hand, Antarctic sea ice behaviour is steady, showing a constant or slightly growing trend for thirty years. If global warming were affecting sea ice (as climate models predict), then Arctic sea ice should be declining in a less jerky manner, and Antarctic sea ice should not be as steady as it is.
Opposing Arguments
People who are alarmed by human-caused global warming still argue that Arctic sea ice extent is varying by smaller and smaller amounts each season. What they fail to understand is that their argument stems from a shortsighted view of a longer-running trend that started BEFORE widespread use of fossil fuel and BEFORE human CO2 production increased.
Ice melts. Ice has been melting since before the twenty-first century, in line with an Earth exiting the last severe glacial epoch within a greater ice age that will melt down even further, thousands of years from now. Ice melts because of long-term climate cycles of galactic-sized forces. Ice melts because of short-term climate cycles of atmospheric pressure and ocean currents. Some of these cycles have periods of oscillation longer than civilizations. Some of these cycles have periods of oscillation approximately decades long. Some of these cycles even go through cycles themselves (of predictability and unpredictability), which is characteristic of a fluid dynamic system such as Earth’s air/ocean system.
How can human CO2 production continually increase and cause only some decades of Arctic sea ice to decline, while enabling other decades to increase? Similarly, how can human CO2 production continually increase and cause Antarctic sea ice to remain the same or to grow?
Proponents of human-caused global warming might claim that climate models predict increased snowfall in the Antarctic, because more warmth draws more moisture into the air that snows out. These same proponents, however, seem to forbid those climate models from predicting increased rainfall and more cloud cover reflecting the sun’s heat, both mitigating increased warming.
Credible evidence (presented above in this article) seems to indicate that climate models are NOT realistically simulating the rhythms of ice-age forcing and atmospheric pressure patterns. Other evidence [which I will present in future articles] seems to indicate that these same climate models are NOT realistically simulating such factors as atmospheric water vapour, clouds, solar energy fluctuations and cosmic ray effects, Earth’s changing geomagnetic field, and Earth’s interior heat with consequent surface heat variations.
CONCLUSION – Keeping It Real
We might do well to view erratic variations of sea ice (over a few decades) with patience. We might best temper any perception of accelerated melting with the longer view over a century or many centuries, where evidence allows such determinations. When we assemble the broadest range of evidence within our current abilities, we see that any accelerating sea-ice melting trend in the Arctic really is a continuation (or even a deceleration) of the same trend that started at least 150 years ago, BEFORE increased human CO2 production. Furthermore, we see that any accelerating sea-ice growing trend in the Antarctic is in line with this region’s prehistoric behaviour, which has been to thrive during some of Earth’s hottest eras.


